Explainer: Why are MOFCOM’s and the Foreign Exchange Bureau’s China FDI Statistics Different?
There is a large discrepancy between the China FDI statistics released by China’s Ministry of Commerce and the foreign exchange bureau. This is due to the different statistical methods adopted by the two government bodies – and is done entirely on purpose. The two FDI figures have different uses and focus on different aspects of the investments. In addition, inbound investment statistics revealed by the foreign exchange bureau showcase a broader scope of foreign investment in China, providing another window into understanding where investors are placing their money in the country.
In January 2022, China’s Ministry of Commerce (MOFCOM) revealed China’s actual use of foreign capital, or FDI inflow, for 2021. According to the figures, China’s FDI inflows broke a new record, reaching US$173.48 billion, up 20.2 percent year on year.
Meanwhile, on March 25, 2022, the State Administration of Foreign Exchange (SAFE) released the 2021 Balance of Payments Report (BOP), which records the flow of money into and out of China. According to the BOP, China recorded a net FDI increase (or net increase in liabilities, per the BOP’s terminology) of US$334 billion, an increase of 32 percent year-over-year.
This brings to mind an obvious question – why the large discrepancy in the FDI statistics from the two government bodies? Below we explain how statistical methods used lead to a difference in the reported numbers and discuss how foreign investors can interpret and use the figures to better understand China’s current economic and investment landscape.
Why are SAFE’s and MOFCOM’s FDI numbers different?
It all comes down to the statistical methods used by the two government bodies. The SAFE, as per the recommendation of international organizations such as the IMF and OECD, adopts the asset/liability principle for estimating FDI inflows. MOFCOM, on the other hand, uses the directional principle for estimating FDI inflows.
Under the asset/liability principle, FDI inflow includes equity investment from parent companies resident in a foreign country to their domestic affiliate companies in the reporting country (in this case China), plus foreign affiliate companies’ investments in their domestic parent companies. The latter is recorded as “affiliate company debt” (关联企业负债 guanlian qiye fuzhai) in the BOP.
Meanwhile, the directional principle only considers the direction of the investment; that is, whether the capital is entering or leaving the reporting country. Under this calculation method, investments by parent companies resident in a foreign company to a domestic affiliate company are included in the inbound FDI, but investments by a domestic affiliate company to a parent company resident in a foreign company are considered outbound investment.
The FDI inflows in the BOP statistics also include the undistributed profits and distributed but unremitted profits of foreign-invested enterprises, loans to shareholders, and the absorption of foreign capital by financial institutions.
In addition, the two statistical methods also treat reverse investment differently. Reverse investment is when an affiliate company invests in its parent company. Under the directional principle, reverse investments are subtracted from the total inbound or outbound investment amounts. For example, investments by domestic affiliate companies in foreign parent companies are subtracted from the total inbound investments (net FDI), and investments by a foreign affiliate company in a domestic parent company are subtracted from the total outbound investment (net ODI).
This is one of the reasons why MOFCOM’s FDI figure is considerably smaller than that reported by SAFE. The two different statistical methods therefore do not contradict each other, but rather rearrange the statistics in order to provide a different view of the flow of capital.
Why use the two different statistical methods?
According to the OECD and IMF, countries are advised to use the assets/liability principle because it makes the FDI statistics consistent with other macroeconomic statistics, which makes analysis of the overall statistics easier. It also gives a better overview of the total assets and liabilities of a country. SAFE compiles FDI data into the BOP, which includes a wide range of statistics, including imports and exports, credit and lending, and primary and secondary income. The assets/liability principle is better suited to present FDI alongside these statistics.
The directional principle, on the other hand, is better suited to show exactly where the investments are coming from and where they are going. This is reflected in the MOFCOM data, which focuses on which sectors attract the most FDI and the source countries of the investments.
FDI versus portfolio investment versus other financial investments – what’s the difference?
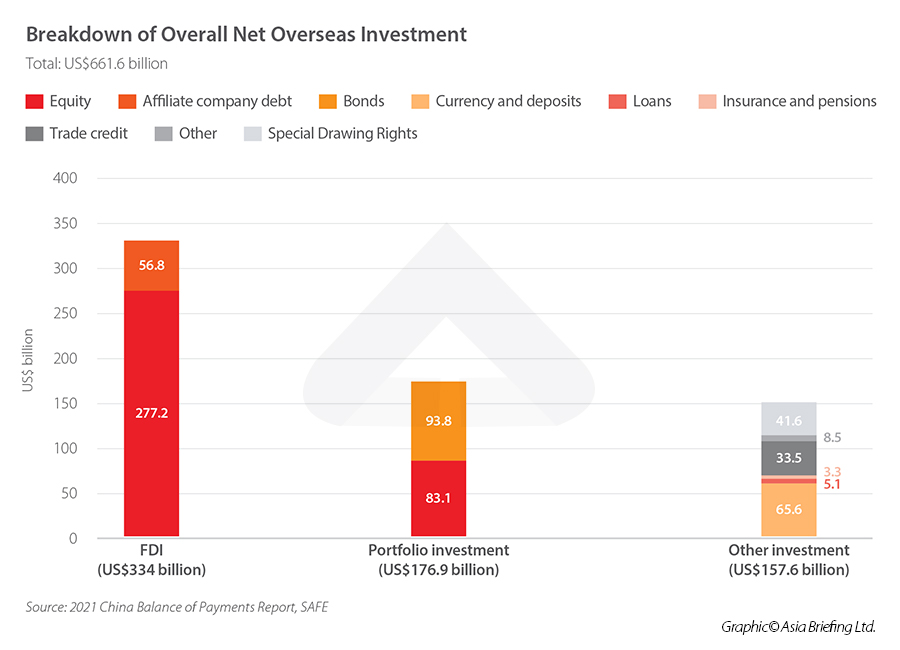
The investment numbers in the BOP released by SAFE cover US$661.6 billion in “total net overseas investment” in 2021. This figure includes the US$334 billion in net FDI discussed above, but also US$176.9 billion in “foreign portfolio investment” (FPI) and US$157.6 billion in “other investments”.
Generally speaking, FDI refers to a longer-term investment, usually in the form of a significant financial investment in a company in China or through the establishment of a new entity or affiliate company in China. The most commonly understood definition of FDI, which is adopted by international institutions such as the OECD, is that the aim of FDI is to establish a lasting interest in a company in the recipient country.
China’s National Bureau of Statistics (NBS) defines FDI as “investment made by foreign investors in China through the establishment of foreign-invested enterprises, partnership enterprises, joint exploration and development of petroleum resources with Chinese investors, and establishment of branches of foreign companies.”
FDI usually excludes investments in stocks or equity if the investor holds a stake of less than 10 percent in a company but includes stakes in excess of 10 percent.
According to MOFCOM, FDI includes the following actions:
- When an individual foreign investor or group of foreign investors sets up an entity in China
- When a foreign investor obtains shares, equity, property shares, or other similar interests in a domestic Chinese company
- When an individual foreign investor or group of foreign investors invests in a new project in China
Meanwhile, the US$176.9 billion worth of FPI recorded in the BOP refers to short-term investments in financial assets in a foreign country, such as equity or bonds. In 2021, investment in equity and bonds reached US$83.1 billion and US$93.8 billion, respectively.
In addition, the SAFE statistics also recorded investments in other financial products, including currency and deposits (US$65.6 billion), insurance and pensions (US$3.3 billion), and trade credits (US$33.5 billion), among others.
What numbers should foreign investors be watching?
SAFE and MOFCOM use different statistical methods to record FDI, but this makes them applicable for analysis of different scenarios.
Given the rather technical nature of the SAFE FDI statistics, these figures are better suited for wider macroeconomic analysis and gaining an understanding of China’s current exposure to global financial risks. Of course, the figure in itself is also an indicator of investors’ overall confidence in China’s markets and economy. As written in the BOP, the strong FDI numbers “show that China’s economic growth has maintained a global leading-edge and its attractiveness to foreign investment has increased.”
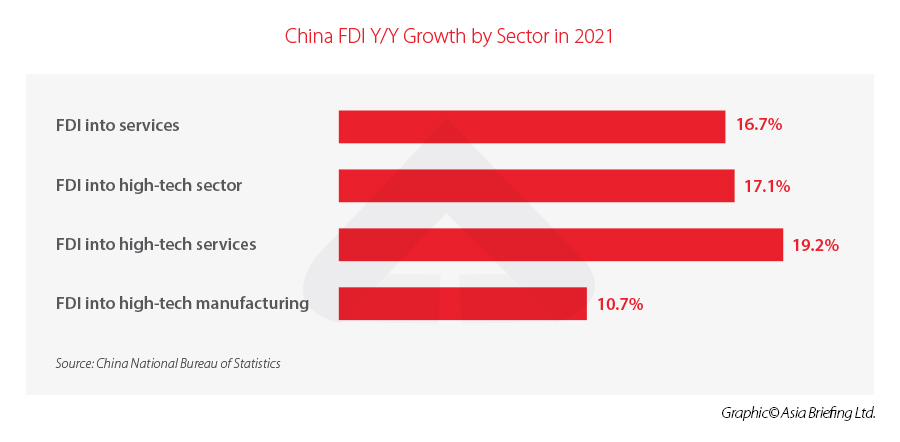
The FDI data revealed by MOFCOM, on the other hand, is better at showcasing investor confidence in various sectors in China, as well as their confidence in the overall economy and business environment. As stated by MOFCOM, China saw record FDI in 2021, with sectors such as services and high-tech seeing particularly strong growth. Given that FDI requires a considerable investment in money, effort, time, and possibly resources and technology on the part of the investors, these figures are a strong indicator that overseas investors and companies see considerable growth potential in these industries and are eager to not only profit off of them, but also contribute to their development in China.
Apart from the difference in the FDI figures, the BOP also offers investors a broader view of investors’ sentiment toward China’s markets. Whereas the FDI statistics reveal the concrete investments made by investors in projects and industries in China, the FPI and investment in other financial products reveal which financial products foreign investors are purchasing.
Strong FPI numbers indicate that overseas investors are confident in China’s financial stability and growth potential. Given the short-term and speculative nature of FPI, investors are generally looking to invest in countries with strong growth potential so that the rewards outweigh the risks.
The 2021 FPI figure was down 28 percent from 2020 due to a strong base effect but was still stronger than in 2019. China’s high economic growth rate in 2020 and 2021 in spite of macroeconomic headwinds is likely looked upon favorably by overseas investors who are looking to get a high return on their investments.
Strong investment numbers in currency and deposits similarly indicate confidence in the RMB, which has been boosted by strong exports and expansion of RMB use in international transactions.
The second difference is in the treatment of reverse investment. Reverse investment is when an affiliate invests in its parent. Under the directional presentation, reverse investment is subtracted to derive the amount of total outward or inward investment of the reporting country. So, if a resident parent borrows money from one of its foreign affiliates, this is subtracted in calculating the reporting country’s outward investment because it reduces the amount of money that that country’s parent company has invested in their foreign affiliates. Similarly, if a resident affiliate lends money to its foreign parent, this is subtracted when calculating inward investment because it reduces the amount of money that the foreign parent has invested in that country.
About Us
China Briefing is written and produced by Dezan Shira & Associates. The practice assists foreign investors into China and has done so since 1992 through offices in Beijing, Tianjin, Dalian, Qingdao, Shanghai, Hangzhou, Ningbo, Suzhou, Guangzhou, Dongguan, Zhongshan, Shenzhen, and Hong Kong. Please contact the firm for assistance in China at china@dezshira.com.
Dezan Shira & Associates has offices in Vietnam, Indonesia, Singapore, United States, Germany, Italy, India, and Russia, in addition to our trade research facilities along the Belt & Road Initiative. We also have partner firms assisting foreign investors in The Philippines, Malaysia, Thailand, Bangladesh.
- Previous Article What Should Employers Pay Attention to When an Employee’s Labor Contract is About to Expire?
- Next Article Belt and Road Weekly Investor Intelligence #76