China’s Industrial Power Rates 2025: A Guide for Investors
China’s industrial power rates depend upon the category of industry, type of electricity usage, region where it is located, time of use, as well as the charging method that the company chooses to go along with. In this article, we offer a rundown of how the industrial power rates are fixed in the country.
The cost of electricity consumption is a critical factor for businesses in the industrial sector, particularly in energy-intensive industries like iron, steel, non-ferrous metals, building materials, chemicals, and advanced manufacturing. As China moves up the value chain in manufacturing higher-technology products, it actively seeks to reduce costs and has implemented measures to lower general industrial power rates.
Over the past few years, the average industrial power rate in China has increased slightly, reaching approximately US$0.088/kWh in 2024, up from US$0.084/kWh in 2019. Despite this uptick, China’s electricity prices remain lower than those in most developing countries, such as India and Mexico.
In 2025, China continued refining its power pricing mechanisms to improve cost transparency, promote efficient usage, and accelerate the integration of renewable energy. Notably, in the first quarter of 2025, China added 74.33 GW of new wind and solar capacity, bringing the total installed capacity of wind and solar to 1.482 billion kW, surpassing coal-fired power capacity (1.451 billion kW) for the first time. Beginning June 2025, all newly commissioned wind and solar projects are required to sell electricity through regional power markets rather than receive fixed feed-in tariffs. While this introduces pricing variability, it also enables qualified enterprises to pursue cost-saving opportunities via direct power purchase agreements (PPAs) and participation in the green electricity certificate (绿证) market.
In this article, we provide an overview of the evolving charging methods for industrial and commercial electricity usage in China and summarize the data on industrial and commercial power rates across major provinces.
China’s Industrial Power Rates: 2025 Highlights
- China’s energy mix is undergoing a structural transformation, with wind and solar capacity reaching 1.482 billion kW in Q1 2025, surpassing coal for the first time. This shift is reshaping power pricing dynamics and expanding low-carbon electricity availability.
- Industrial electricity pricing in China is increasingly market-driven and regionally differentiated, with two-part pricing models and time-of-use (TOU) structures offering savings.
- Investors and manufacturers can gain a competitive edge by optimizing production schedules around low-cost periods, leveraging green power purchase agreements (PPAs), and strategically locating in regions with abundant renewables and flexible pricing schemes.
Overview of charging methods for industrial power
China charges electricity fees according to four types of electricity usage, namely residential electricity, agriculture production electricity, general commercial and industrial electricity, and large-scale industrial electricity.
General commercial and industrial electricity mainly involves small and medium-sized enterprises (SMEs) with a total transformer capacity of no more than 315 kVA. Large-scale industry users have a total transformer capacity of above 315 kVA.
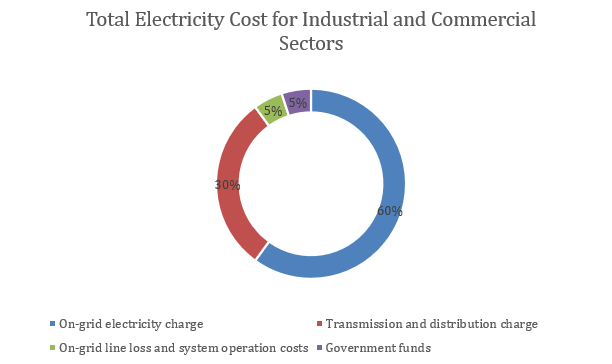
For commercial and industrial electricity usage, the total charge is divided into four parts: On-grid electricity charge, transmission and distribution charge, on-grid line loss and system operation costs, and charge to government funds.
TOTAL ELECTRICITY CHARGE = ON-GRID ELECTRICITY CHARGE + TRANSMISSION AND DISTRIBUTION CHARGE + ON-GRID LINE LOSS AND SYSTEM OPERATION COSTS + CHARGE TO GOVERNMENT FUNDS
On-grid electricity charge is the charge based on the settlement price for electricity provided by power generation companies, accounting for around 60 percent of the total electricity cost. The on-grid electricity charge is influenced by heavily influenced by market-based transactions and time-of-use (TOU) pricing.The increasing adoption of renewable power sources like wind and solar is reshaping this component.
China has been actively promoting TOU pricing across different regions for commercial and industrial sectors. TOU pricing differentiates electricity rates based on “peak hours” and “valley hours.” Electricity prices increase during peak hours and decrease during valley hours. This strategic adjustment aims to incentivize energy consumption during off-peak periods, encouraging more efficient energy use and effective demand management. (More details on TOC pricing are provided in the following sections)
Transmission and distribution charge is determined based on the permitted income of the grid enterprises’ transmission and distribution business, divided by voltage levels and user categories, which account for around 30 percent of the total electricity cost.
The transmission and distribution charge varies depending on whether a single-part or two-part pricing method is chosen. Previously, the general commercial and industrial sectors were charged based on the cost per unit at three voltage levels: 1kV, 10kV, and 35kV (single-part price).
For large-scale industry users, the cost of electricity consumption was divided into two parts (two-part price):
- Fixed charges based on maximum demand or transformer capacity
- Charges based on the user’s actual electricity consumption
However, as part of China’s efforts to enhance its business environment, some enterprises in the general commercial and industrial sectors now have the option to choose between the single-part price and the two-part price, providing increased pricing flexibility. (More details on two-part price are provided in the following sections)
On-grid line losses are costs incurred by the grid enterprises for procuring line-loss electricity (with a comprehensive on-grid line loss rate of 3.31 percent). The procurement gains and losses are settled monthly, and the resulting gains and losses are shared among all users who follow the commercial and industrial electricity pricing. System operation costs include auxiliary service fees, pumped storage capacity electricity fees, and various gain and loss allocations, which are also settled monthly. They account for around five percent of the total electricity cost.
Government funds constituting part of the electricity charge are surcharges related to social and economic factors beyond the production and transmission of electricity itself and are used for specific purposes related to energy and power development. They account for around five percent of the total electricity cost. These fees are collected by the grid company on behalf of the government when collecting electricity fees, based on the charging objects and standards. In recent years, the overall level of government funds and surcharges has shown a decreasing trend.
TOU pricing
In simple terms, TOU pricing refers to the practice of dividing the 24-hour day into several periods based on the system’s operational status, with electricity charges for each period reflecting the system’s average marginal cost. TOU pricing encourages and incentivizes electricity users to shift their usage to off-peak times, optimizing their electricity consumption patterns.
Since the 1980s, China has gradually implemented TOU pricing mechanisms across various regions. The specific implementation of TOU pricing varies by region. For example, most regions divide the day into peak, off-peak, and valley periods, applying different rates accordingly. Some provinces have added a critical peak period on top of this. In places like Sichuan, the year is divided into wet and dry seasons, with higher rates applied during the dry season when electricity supply is tight. In some other areas, the year is divided into summer and non-summer periods, with higher seasonal rates applied during the peak summer months.
On July 29, 2021, to deepen electricity price reforms and improve the pricing mechanism, the National Development and Reform Commission (NDRC) issued the “Notice on Further Improving the Time-of-Use Pricing Mechanism” (NDRC Price [2021] No. 1093). This notice further refined the existing TOU pricing mechanism to better signal electricity costs, support the construction of a new power system dominated by renewable energy, and promote green and low-carbon energy development.
Following the requirements set in NDRC’s notice, local governments have issued the updated TOU electricity pricing policies from 2021 to 2024. Most of the newly issued pricing policies focus on refining the division of peak and valley periods, increasing the price differential between peak and valley periods, and establishing a high peak pricing mechanism. Moreover, large-scale industrial users are required to adopt TOU pricing in principle, while general industrial and commercial users have more flexibility—they can choose whether or not to apply TOU pricing based on their business nature.
As of May 2025, the most common TOU structure currently in use is the three-level model, which includes peak, off-peak, and valley hours. This represents a shift from previous years, when four- or five-level structures were more widely adopted. The growing share of renewable energy in the power mix has allowed more regions to lower electricity prices during non-peak periods and has helped alleviate pressure during critical peak hours.
| Type of TOU | Regions | Number of regions |
| 3 levels:
Peak Off-peak Valley |
Jiangsu, Anhui, Shaanxi, Beijing, Henan, Shanghai, Chongqing, Sichuan, Heilongjiang, Liaoning, Fujian, Inner Mongolia (East), Hunan, Shanxi, Guangxi, Qinghai, Ningxia, Tianjin, Guizhou, Yunnan, | 20 |
| 4 levels:
Critical peak Peak Off-peak Valley |
Guangdong (Pearl River Delta, Huizhou, Jiangmen, East and West region, and Shenzhen), Hebei, Hainan, Hubei. | 8 |
| 4 levels:
Peak Off-peak Valley Deep valley |
Zhejiang, Jiangxi, and Xinjiang. | 3 |
| 5 levels:
Critical peak Peak Off-peak Valley Deep valley |
Shandong | 1 |
Two-part pricing
The single-part electricity pricing system is straightforward and easy to understand. It is calculated based on the actual electricity consumption recorded by the user’s meter and is not related to equipment capacity. Regardless of the amount of electricity used, a flat rate is applied. Users simply need to multiply their monthly electricity consumption by the unit price to calculate the total electricity bill.
SINGLE-PART ELECTRICITY CHARGE = MONTHLY ELECTRICITY CONSUMPTION ×UNIT PRICE
The two-part tariff is a pricing strategy where consumers pay a fixed fee to access the service, in addition to a variable fee based on usage. It consists of two components: Basic electricity charge and electricity charge based on consumption.
| Two-Part Electricity Charging Method | |
| Electricity Charge Under Two-Part = Basic Electricity Charge + Electricity Charge Based On Consumption | |
| Electricity charge based on consumption | The variable charge depends on the user’s actual electricity consumption. Cost per unit is based on four voltage levels –10kV, 35kV, 110kV, and 220kV, as well as the timing of the electricity usage. |
| Basic electricity charge | This fixed charge reflects the capacity costs and is calculated based on the user’s equipment capacity (kVA) or maximum demand (kW, contract maximum demand, or actual maximum demand).
|
Previously, only large-scale industries with transformer capacities exceeding 315kVA could apply the two-part pricing. Nevertheless, according to the updated document NDRC Price [2023] No.526, general commercial and industrial enterprises with transformer capacities between 100 kVA and 315 kVA can now have the option to choose between being charged based on a single or two-part price. Moreover, the notice clarifies that:
- Users with transformer capacities of 100 kVA and below, the single-part pricing mechanism applies.
- Users with transformer capacity of 315 kVA and above, the two-part pricing mechanism applies. However, if such users are currently on a single-rate pricing mechanism, they can choose between a single-rate or a two-part pricing mechanism. Some regions further specify that once two-part pricing is selected, the user will not be allowed to change back to single-part pricing.
The choice between single-part and two-part electricity pricing depends on factors such as user voltage level, electricity capacity, contract capacity, maximum demand, and load ratio. While it may seem complex, the key comparison lies in assessing the difference between single-part and two-part electricity charges in relation to capacity (or demand) charges.
When selecting charging methods, it is important take the following factors into consideration :
- At the same voltage level, the single-part electricity price is higher than the two-part electricity price.
- At the same voltage level, under the two-part price mechanism, the basic electricity price calculated based on the user’s maximum demand (kW) is approximately 1.6 times that calculated based on the user’s equipment capacity (kVA).
- For users opting for the demand-based pricing method under the two-part pricing mechanism, if their monthly electricity consumption per kVA reaches 260 kWh or more, the demand-based price for that month will be charged at 90 percent of the standard rate. The monthly electricity consumption per kVA is calculated by dividing the total electricity consumption of all metering points by the contracted transformer capacity.
Market reforms: 2025 updates on renewable energy pricing mechanism
A significant policy shift occurred in January 2025, when the NDRC introduced a new framework titled Deepening Market-Based Reforms for Renewable On-Grid Electricity Pricing (NDRC Price [2025] No.136). This policy marks a new stage in China’s power market liberalization and aims to accelerate the integration of wind and solar energy into a competitive electricity market while stabilizing investor expectations. The key features of the reform are as follows:
-
Mandatory market participation for renewable projects: All new energy projects—wind and solar—are, in principle, required to participate in power market trading. On-grid electricity prices for these projects will be formed through market mechanisms. Project operators may submit quantity-price bids or accept market-cleared prices. Cross-provincial and cross-regional transactions will continue to follow relevant transmission pricing policies.
-
Enhancement of real-time and mid-to-long-term markets: The reform supports improved access for renewables to the real-time market and encourages voluntary participation in the day-ahead market. Real-time price caps and floors will be determined based on regional conditions such as industrial peak tariffs and alternative revenue streams available to renewable producers. Meanwhile, mid-to-long-term trading will become more frequent and flexible, allowing contracts to reflect variable output curves and include green certificate (绿证) pricing components.
-
Introduction of a contract-for-difference settlement mechanism: For both legacy and new renewable projects, a sustainable pricing settlement mechanism will be implemented outside the power market. This mechanism allows for a difference in settlement between market prices and a fixed mechanism price determined by provincial authorities. If the market price is lower than the mechanism price, the grid operator pays the difference to the generator; if it is higher, the excess is returned. The settlement cost will be absorbed into local system operating expenses.
-
Legacy vs. new projects: Legacy projects (commissioned before June 1, 2025) will continue under current pricing policies, with capped mechanism prices not exceeding local coal-fired benchmarks. Annual volume and participation can be self-determined but must remain within previous limits. New projects (commissioned after June 1, 2025), however, must compete annually for inclusion in the mechanism. Participating projects will be selected through competitive bidding, with the highest accepted bid setting the mechanism’s ceiling price. Execution periods will align with typical investment payback timelines and vary by technology type.
-
Policy safeguards: The policy also prohibits unfair charges on renewable producers and bans the use of energy storage as a precondition for project approval or grid access. Projects receiving central government subsidies will continue to follow existing feed-in hour standards. Importantly, electricity volumes already settled under this mechanism cannot be used to claim green certificate revenues, preventing double counting.
This reform signals a transition toward a more transparent and responsive electricity market—one that better reflects supply-demand dynamics, accommodates growing renewable capacity, and supports stable investor returns through a market-linked risk management mechanism.
China’s industrial power rates by region
In this section, we present a summary of the single-part and two-part pricing data released by various provinces, factoring in the TOU pricing adjustments. Please note that power rates are regularly updated. The data in the tables below are as of May 2025 and are provided for reference purposes only.
Single-part pricing in major provinces/cities
| Power Rates under Single Part Pricing by Region | |||||||
| Region | Transformer capacity | Cost per unit (RMB/kWh) | |||||
| Non-TOU pricing | TOU pricing | ||||||
| Standard | Critical Peak | Peak | Off-Peak | Valley | Deep valley | ||
| Jiangsu | <1 kV | 0.736 | / | 1.230 | 0.736 | 0.333 | / |
| 1-10 kV | 0.710 | / | 1.187 | 0.710 | 0.321 | / | |
| 35 kV | 0.685 | / | 1.145 | 0.685 | 0.309 | / | |
| Anhui
|
<1 kV | 0.698 | / | 1.138 | 0.698 | 0.331 | / |
| 1-10 kV | 0.678 | / | 1.103 | 0.678 | 0.323 | / | |
| 35 kV | 0.658 | / | 1.069 | 0.658 | 0.315 | / | |
| Guangdong (Pearl River Delta) | <1 kV | 0.811 | 1.692 | 1.359 | 0.811 | 0.325 | / |
| 1-10 kV | 0.786 | 1.639 | 1.317 | 0.786 | 0.316 | / | |
| 35 kV | 0.744 | 1.550 | 1.245 | 0.744 | 0.300 | / | |
| Guangdong (Huizhou) | <1 kV | 0.784 | 1.636 | 1.314 | 0.784 | 0.315 | / |
| 1-10 kV | 0.760 | 1.583 | 1.272 | 0.760 | 0.306 | / | |
| 35 kV | 0.717 | 1.493 | 1.200 | 0.717 | 0.290 | / | |
| Guangdong (Jiangmen) | <1 kV | 0.807 | 1.684 | 1.352 | 0.807 | 0.324 | / |
| 1-10 kV | 0.782 | 1.631 | 1.311 | 0.782 | 0.314 | / | |
| 35 kV | 0.740 | 1.541 | 1.239 | 0.740 | 0.298 | / | |
| Guangdong (East and West region) | <1 kV | 0.725 | 1.510 | 1.214 | 0.725 | 0.293 | / |
| 1-10 kV | 0.701 | 1.458 | 1.172 | 0.701 | 0.283 | / | |
| 35 kV | 0.658 | 1.368 | 1.010 | 0.658 | 0.267 | / | |
| Shandong | <1 kV | 0.716 | 1.214 | 1.065 | 0.716 | 0.368 | 0.268 |
| 1-10 kV | 0.701 | 1.199 | 1.050 | 0.701 | 0.353 | 0.253 | |
| 35 kV | 0.686 | 1.184 | 1.035 | 0.686 | 0.328 | 0.235 | |
| Shanxi | <1 kV | 0.558 | / | 0.760 | 0.558 | 0.373 | / |
| 1-10 kV | 0.538 | / | 0.740 | 0.538 | 0.353 | / | |
| 35 kV | 0.523 | / | 0.725 | 0.523 | 0.338 | / | |
| Beijing | <1 kV | 0.853 | / | 1.134 | 0.853 | 0.599 | / |
| 1-10 kV | 0.833 | / | 1.150 | 0.833 | 0.556 | / | |
| 35 kV | 0.763 | / | 1.080 | 0.763 | 0.486 | / | |
| ≥ 220 kV | 0.718 | / | 1.035 | 0.718 | 0.441 | / | |
| Hebei | <1 kV | 0.693 | 1.118 | 0.979 | 0.693 | 0.406 | / |
| 1-10 kV | 0.673 | 1.098 | 0.959 | 0.673 | 0.386 | / | |
| 35-110 kV | 0.653 | 1.078 | 0.939 | 0.653 | 0.366 | / | |
| ≥ 220 kV | 0.653 | 1.078 | 0.939 | 0.653 | 0.366 | / | |
| Henan | <1 kV | 0.730 | / | 1.153 | 0.730 | 0.389 | / |
| 1-10 kV | 0.710 | / | 1.105 | 0.710 | 0.377 | / | |
| 35-110 kV | 0.690 | / | 1.059 | 0.690 | 0.365 | / | |
| Zhejiang | <1 kV | 0.741 | / | 1.112 | 0.741 | 0.334 | 0.148 |
| 1-10 kV | 0.720 | / | 1.081 | 0.720 | 0.324 | 0.144 | |
| 35 kV | 0.683 | / | 1.024 | 0.683 | 0.307 | 0.137 | |
| Shanghai | <1 kV | 0.800 | / | 0.923 | 0.800 | 0.474 | / |
| 1-10 kV | 0.755 | / | 0.870 | 0.755 | 0.449 | / | |
| 35 kV | 0.710 | / | 0.818 | 0.710 | 0.425 | / | |
| Chongqing | <1 kV | 0.778 | / | / | 0.778 | / | / |
| 1-10 kV | 0.758 | / | 1.155 | 0.758 | 0.349 | / | |
| 35 kV | 0.738 | / | 1.122 | 0.738 | 0.341 | / | |
| Sichuan | <1 kV | 0.722 | / | 1.094 | 0.722 | 0.351 | / |
| 1-10 kV | 0.696 | / | 1.051 | 0.696 | 0.341 | / | |
| 35 kV | 0.665 | / | 1.002 | 0.665 | 0.328 | / | |
| Heilongjiang | <1 kV | 0.777 | / | 0.977 | 0.777 | 0.578 | / |
| 1-10 kV | 0.767 | / | 0.967 | 0.767 | 0.567 | / | |
| 35 kV | 0.756 | / | 0.956 | 0.756 | 0.556 | / | |
| Liaoning | <1 kV | 0.744 | / | 0.959 | 0.744 | 0.528 | / |
| 1-10 kV | 0.722 | / | 0.938 | 0.722 | 0.507 | / | |
| 35 kV | 0.701 | / | 0.917 | 0.701 | 0.486 | / | |
| Fujian | <1 kV | 0.679 | / | 0.928 | 0.679 | 0.408 | / |
| 1-10 kV | 0.659 | / | 0.908 | 0.659 | 0.388 | / | |
| 35 kV | 0.639 | / | 0.888 | 0.639 | 0.368 | / | |
| Inner Mongolia (East) | <1 kV | 0.738 | / | 0.933 | 0.738 | 0.590 | / |
| 1-10 kV | 0.701 | / | 0.896 | 0.701 | 0.553 | / | |
| 35 kV | 0.616 | / | 0.810 | 0.616 | 0.467 | / | |
| Jiangxi | <1 kV | 0.685 | / | 0.995 | 0.685 | 0.375 | 0.313 |
| 1-10 kV | 0.670 | / | 0.972 | 0.670 | 0.368 | 0.307 | |
| 35 kV | 0.655 | / | 0.050 | 0.655 | 0.360 | 0.301 | |
| Hunan | <1 kV | 0.815 | / | 1.276 | 0.815 | 0.354 | / |
| 1-10 kV | 0.795 | / | 1.244 | 0.795 | 0.346 | / | |
| 35 kV | 0.775 | / | 1.212 | 0.775 | 0.338 | / | |
| Shaanxi | <1 kV | 0.627 | / | 0.907 | 0.627 | 0.347 | / |
| 1-10 kV | 0.607 | / | 0.878 | 0.607 | 0.337 | / | |
| 35 kV | 0.587 | / | 0.847 | 0.587 | 0.327 | / | |
| Xinjiang | <1 kV | 0.453 | / | 0.603 | 0.453 | 0.326 | 0.286 |
| 1-10 kV | 0.450 | / | 0.600 | 0.450 | 0.323 | 0.283 | |
| 35 kV | 0.446 | / | 0.596 | 0.446 | 0.319 | 0.279 | |
| Guangxi | <1 kV | 0.702 | / | 0.881 | 0.702 | 0.523 | / |
| 1-10 kV | 0.689 | / | 0.808 | 0.689 | 0.510 | / | |
| 35 kV | 0.670 | / | 0.849 | 0.670 | 0.490 | / | |
| Hainan | <1 kV | 0.869 | 1.646 | 1.392 | 0.869 | 0.421 | / |
| 1-10 kV | 0.846 | 1.599 | 1.353 | 0.846 | 0.412 | / | |
| Hubei | <1 kV | 0.712 | 1.063 | 0.927 | 0.712 | 0.485 | / |
| 1-10 kV | 0.692 | 1.043 | 0.907 | 0.692 | 0.465 | / | |
| 35 kV | 0.672 | 1.023 | 0.887 | 0.672 | 0.445 | / | |
| Qinghai | <1 kV | 0.507 | / | 0.686 | 0.507 | 0.322 | / |
| 1-10 kV | 0.502 | / | 0.681 | 0.502 | 0.317 | / | |
| 35 kV | 0.497 | / | 0.676 | 0.497 | 0.312 | / | |
| Ningxia | <1 kV | 0.503 | / | 0.682 | 0.503 | 0.354 | / |
| 1-10 kV | 0.483 | / | 0.662 | 0.483 | 0.334 | / | |
| 35 kV | 0.463 | / | 0.642 | 0.463 | 0.314 | / | |
| Tianjin | <1 kV | 0.833 | / | 1.196 | 0.833 | 0.442 | / |
| 1-10 kV | 0.800 | / | 1.147 | 0.800 | 0.427 | / | |
| 35 kV | 0.736 | / | 1.050 | 0.736 | 0.397 | / | |
| Guizhou | <1 kV | 0.718 | / | / | 0.718 | / | / |
| 1-10 kV | 0.706 | / | / | 0.706 | / | / | |
| 35 kV | 0.680 | / | / | 0.680 | / | / | |
| Yunnan | <1 kV | 0.557 | / | 0.714 | 0.557 | 0.400 | / |
| 1-10 kV | 0.547 | / | 0.704 | 0.547 | 0.390 | / | |
| 35 kV | 0.537 | / | 0.694 | 0.537 | 0.537 | / | |
| Shenzhen | <1 kV | 0.725 | 1.510 | 1.214 | 0.725 | 0.293 | / |
| 1-10 kV | 0.700 | 1.458 | 1.172 | 0.700 | 0.283 | / | |
| 35 kV | 0.658 | 1.368 | 1.100 | 0.658 | 0.267 | / | |
Two-part pricing in major provinces/cities
| Power Rates under Two-Part Pricing by Region | |||||||||
| Region | Transformer capacity | Cost per unit (RMB/kWh) | Basic charges | ||||||
| Non-TOU pricing | TOU pricing | By maximum demand (RMB/kW/mon) | By transformer capacity (RMB/kVA/mon) | ||||||
| Critical Peak | Peak | Off-Peak | Valley | Deep-Valley | |||||
| Jiangsu | 1-10 kV | 0.632 | / | 1.087 | 0.632 | 0.265 | / | 51.2 | 32 |
| 35 kV | 0.607 | / | 1.044 | 0.607 | 0.254 | / | 48 | 30 | |
| 110 kV | 0.582 | / | 1.001 | 0.582 | 0.244 | / | 44.8 | 28 | |
| ≥ 220 kV | 0.556 | / | 0.957 | 0.556 | 0.233 | / | 41.6 | 26 | |
| Anhui | 1-10 kV | 0.660 | / | 1.071 | 0.660 | 0.316 | / | 48 | 30 |
| 35 kV | 0.634 | / | 1.027 | 0.634 | 0.306 | / | 45.6 | 28.5 | |
| 110 kV | 0.609 | / | 0.983 | 0.609 | 0.297 | / | 44 | 27.5 | |
| ≥ 220 kV | 0.584 | / | 0.940 | 0.584 | 0.287 | / | 40.8 | 25.5 | |
| Guangdong (Pearl River Delta) | 1-10 kV | 0.713 | 1.483 | 1.192 | 0.713 | 0.288 | / | 36.1 | 22.6 |
| 35 kV | 0.688 | 1.430 | 1.150 | 0.688 | 0.278 | / | 31 | 19.4 | |
| 110 kV | 0.688 | 1.430 | 1.150 | 0.688 | 0.278 | / | 31 | 19.4 | |
| ≥ 220 kV | 0.660 | 1.371 | 1.102 | 0.660 | 0.268 | / | 26.1 | 16.3 | |
| Guangdong (Huizhou) | 1-10 kV | 0.686 | 1.427 | 1.147 | 0.686 | 0.278 | / | 36.1 | 22.6 |
| 35 kV | 0.661 | 1.374 | 1.105 | 0.661 | 0.268 | / | 31 | 19.4 | |
| 110 kV | 0.661 | 1.374 | 1.105 | 0.661 | 0.268 | / | 31 | 19.4 | |
| ≥ 220 kV | 0.634 | 1.315 | 1.058 | 0.634 | 0.258 | / | 26.1 | 16.3 | |
| Guangdong (Jiangmen) | 1-10 kV | 0.709 | 1.475 | 1.186 | 0.709 | 0.287 | / | 36.1 | 22.6 |
| 35 kV | 0.684 | 1.422 | 1.143 | 0.684 | 0.278 | / | 31 | 19.4 | |
| 110 kV | 0.684 | 1.422 | 1.143 | 0.684 | 0.278 | / | 31 | 19.4 | |
| ≥ 220 kV | 0.656 | 1.363 | 1.096 | 0.656 | 0.267 | / | 26.1 | 16.3 | |
| Guangdong (East and West region) | 1-10 kV | 0.627 | 1.302 | 1.047 | 0.627 | 0.256 | / | 36.1 | 22.6 |
| 35 kV | 0.602 | 1.280 | 1.004 | 0.602 | 0.246 | / | 31 | 19.4 | |
| 110 kV | 0.602 | 1.248 | 1.004 | 0.602 | 0.246 | / | 31 | 19.4 | |
| ≥ 220 kV | 0.574 | 1.190 | 0.957 | 0.574 | 0.235 | / | 26.1 | 16.3 | |
| Shandong | 1-10 kV | 0.643 | 1.141 | 0.992 | 0.643 | 0.294 | 0.195 | 38.4 | 24 |
| 35 kV | 0.628 | 1.126 | 0.977 | 0.628 | 0.279 | 0.180 | 35.2 | 22 | |
| 110 kV | 0.613 | 1.111 | 0.962 | 0.613 | 0.265 | 0.165 | 35.2 | 22 | |
| ≥ 220 kV | 0.598 | 1.095 | 0.907 | 0.598 | 0.249 | 0.180 | 32 | 20 | |
| Shanxi | 1-10 kV | 0.516 | / | 0.718 | 0.516 | 0.331 | / | 36 | 22.5 |
| 35 kV | 0.486 | / | 0.688 | 0.486 | 0.301 | / | 36 | 22.5 | |
| 110 kV | 0.461 | / | 0.663 | 0.461 | 0.276 | / | 33.6 | 21 | |
| ≥ 220 kV | 0.441 | / | 0.643 | 0.441 | 0.256 | / | 33.6 | 21 | |
| Beijing | 1-10 kV | 0.650 | / | 0.889 | 0.650 | 0.412 | / | 51 | 32 |
| 35 kV | 0.610 | / | 0.847 | 0.610 | 0.371 | / | 48 | 30 | |
| 110 kV | 0.610 | / | 0.847 | 0.610 | 0.371 | / | 48 | 30 | |
| ≥ 220 kV | 0.590 | / | 0.832 | 0.590 | 0.356 | / | 45 | 28 | |
| Hebei | 1-10 kV | 0.650 | 1.080 | 0.940 | 0.650 | 0.360 | / | 35 | 21.9 |
| 35 kV | 0.630 | 1.060 | 0.920 | 0.630 | 0.340 | / | 35 | 21.9 | |
| 110 kV | 0.610 | 1.040 | 0.900 | 0.610 | 0.320 | / | 32 | 20 | |
| ≥ 220 kV | 0.590 | 1.020 | 0.880 | 0.590 | 0.300 | / | 32 | 20 | |
| Henan | 1-10 kV | 0.693 | / | 1.054 | 0.693 | 0.378 | / | 40 | 25 |
| 35 kV | 0.670 | / | 1.067 | 0.670 | 0.367 | / | 36.9 | 23 | |
| 110 kV | 0.646 | / | 1.025 | 0.646 | 0.356 | / | 33.7 | 21 | |
| ≥ 220 kV | 0.628 | / | 0.994 | 0.628 | 0.348 | / | 30.5 | 19 | |
| Zhejiang | 1-10 kV | 0.632 | / | 0.948 | 0.632 | 0.284 | 0.126 | 48 | 30 |
| 35 kV | 0.601 | / | 0.902 | 0.601 | 0.271 | 0.120 | 44.8 | 28 | |
| 110 kV | 0.585 | / | 0.878 | 0.585 | 0.263 | 0.117 | 41.6 | 26 | |
| ≥ 220 kV | 0.575 | / | 0.862 | 0.575 | 0.259 | 0.115 | 38.3 | 24 | |
| Shanghai | 1-10 kV | 0.651 | / | 0.997 | 0.651 | 0.364 | / | 40.8 | 25.5 |
| 35 kV | 0.620 | / | 0.946 | 0.620 | 0.348 | / | 40.8 | 25.5 | |
| 110 kV | 0.589 | / | 0.898 | 0.589 | 0.333 | / | 40.8 | 25.5 | |
| ≥ 220 kV | 0.579 | / | 0.881 | 0.579 | 0.328 | / | 38.4 | 24 | |
| Chongqing | 1-10 kV | 0.699 | / | 1.059 | 0.699 | 0.326 | / | 35.2 | 22 |
| 35 kV | 0.673 | / | 1.019 | 0.673 | 0.316 | / | 35.2 | 22 | |
| 110 kV | 0.654 | / | 0.988 | 0.654 | 0.309 | / | 32 | 20 | |
| ≥ 220 kV | 0.635 | / | 0.957 | 0.635 | 0.302 | / | 32 | 20 | |
| Sichuan | 1-10 kV | 0.605 | / | 0.906 | 0.605 | 0.304 | / | 35.2 | 22 |
| 35 kV | 0.576 | / | 0.859 | 0.576 | 0.293 | / | 35.2 | 22 | |
| 110 kV | 0.533 | / | 0.791 | 0.533 | 0.276 | / | 32 | 20 | |
| ≥ 220 kV | 0.514 | / | 0.760 | 0.514 | 0.268 | / | 32 | 20 | |
| Heilongjiang | 1-10 kV | 0.630 | / | 0.830 | 0.630 | 0.430 | / | 36.8 | 23 |
| 35 kV | 0.609 | / | 0.808 | 0.609 | 0.409 | / | 36.8 | 23 | |
| 110 kV | 0.596 | / | 0.796 | 0.596 | 0.396 | / | 35.2 | 22 | |
| ≥ 220 kV | 0.569 | / | 0.769 | 0.569 | 0.370 | / | 35.2 | 22 | |
| Liaoning | 1-10 kV | 0.616 | / | 0.832 | 0.616 | 0.401 | / | 36.8 | 23 |
| 35 kV | 0.598 | / | 0.814 | 0.598 | 0.382 | / | 36.8 | 23 | |
| 110 kV | 0.598 | / | 0.814 | 0.598 | 0.382 | / | 35.2 | 22 | |
| ≥ 220 kV | 0.571 | / | 0.787 | 0.571 | 0.355 | / | 33.6 | 21 | |
| Fujian | 1-10 kV | 0.625 | / | 0.874 | 0.625 | 0.354 | / | 40 | 25 |
| 35 kV | 0.605 | / | 0.854 | 0.605 | 0.334 | / | 39 | 24.4 | |
| 110 kV | 0.580 | / | 0.829 | 0.580 | 0.309 | / | 38 | 23.8 | |
| ≥ 220 kV | 0.555 | / | 0.804 | 0.555 | 0.284 | / | 37 | 23.1 | |
| Inner Mongolia (East) | 1-10 kV | 0.514 | / | 0.788 | 0.514 | 0.365 | / | 32.8 | 20.5 |
| 35 kV | 0.507 | / | 0.701 | 0.507 | 0.358 | / | 32.8 | 20.5 | |
| 110 kV | 0.467 | / | 0.661 | 0.467 | 0.319 | / | 31.2 | 19.5 | |
| ≥ 220 kV | 0.444 | / | 0.638 | 0.444 | 0.296 | / | 31.2 | 19.5 | |
| Jiangxi | 1-10 kV | 0.659 | / | 0.955 | 0.659 | 0.362 | 0.303 | 42.3 | 26.4 |
| 35 kV | 0.644 | / | 0.933 | 0.644 | 0.355 | 0.297 | 40.6 | 25.4 | |
| 110 kV | 0.629 | / | 0.910 | 0.629 | 0.347 | 0.291 | 39.1 | 24.4 | |
| ≥ 220 kV | 0.619 | / | 0.895 | 0.619 | 0.342 | 0.287 | 37.5 | 23.4 | |
| Hunan | 1-10 kV | 0.728 | / | 1.137 | 0.728 | 0.319 | / | 33.8 | 21.1 |
| 35 kV | 0.698 | / | 1.089 | 0.698 | 0.307 | / | 33.8 | 21.1 | |
| 110 kV | 0.669 | / | 1.043 | 0.669 | 0.295 | / | 30.6 | 19.1 | |
| ≥ 220 kV | 0.644 | / | 1.002 | 0.644 | 0.285 | / | 30.6 | 19.1 | |
| Shaanxi | 1-10 kV | 0.529 | / | 0.819 | 0.529 | 0.238 | / | 35.2 | 22 |
| 35 kV | 0.509 | / | 0.787 | 0.509 | 0.231 | / | 35.2 | 22 | |
| 110 kV | 0.489 | / | 0.754 | 0.489 | 0.223 | / | 32 | 20 | |
| ≥ 220 kV | 0.479 | / | 0.738 | 0.479 | 0.219 | / | 32 | 20 | |
| Xinjiang | 1-10 kV | 0.410 | / | 0.559 | 0.410 | 0.283 | 0.243 | 32 | 20 |
| 35 kV | 0.399 | / | 0.549 | 0.399 | 0.272 | 0.232 | 32 | 20 | |
| 110 kV | 0.371 | / | 0.521 | 0.371 | 0.244 | 0.204 | 30.4 | 19 | |
| ≥ 220 kV | 0.338 | / | 0.488 | 0.338 | 0.211 | 0.171 | 30.4 | 19 | |
| Guangxi | 1-10 kV | 0.581 | / | 0.760 | 0.581 | 0.402 | / | 38.7 | 24.2 |
| 35 kV | 0.539 | / | 0.718 | 0.539 | 0.359 | / | 37.3 | 23.3 | |
| 110 kV | 0.511 | / | 0.690 | 0.511 | 0.332 | / | 34.2 | 21.4 | |
| ≥ 220 kV | 0.462 | / | 0.641 | 0.462 | 0.283 | / | 32 | 20 | |
| Hainan | <35kV | 0.745 | 1.393 | 1.181 | 0.745 | 0.371 | / | 35.2 | 22 |
| 35 kV | 0.691 | 1.283 | 1.090 | 0.691 | 0.350 | / | 35.2 | 22 | |
| 110 kV | 0.690 | 1.280 | 1.087 | 0.690 | 0.349 | / | 35.2 | 22 | |
| ≥ 220 kV | 0.680 | 1.260 | 1.070 | 0.680 | 0.345 | / | 35.2 | 22 | |
| Hubei | 1-10 kV | 0.628 | 0.979 | 0.843 | 0.628 | 0.401 | / | 42 | 26.3 |
| 35 kV | 0.609 | 0.959 | 0.823 | 0.609 | 0.381 | / | 42 | 26.3 | |
| 110 kV | 0.591 | 0.941 | 0.805 | 0.591 | 0.363 | / | 39 | 24.4 | |
| ≥ 220 kV | 0.572 | 0.922 | 0.786 | 0.572 | 0.344 | / | 39 | 24.4 | |
| Qinghai | 1-10 kV | 0.405 | / | 0.583 | 0.405 | 0.220 | / | 33.6 | 21 |
| 35 kV | 0.399 | / | 0.578 | 0.399 | 0.215 | / | 33.6 | 21 | |
| 110 kV | 0.389 | / | 0.568 | 0.389 | 0.204 | / | 32 | 20 | |
| ≥ 220 kV | 0.379 | / | 0.558 | 0.379 | 0.194 | / | 32 | 20 | |
| Ningxia | 1-10 kV | 0.411 | / | 0.589 | 0.411 | 0.262 | / | 28.8 | 18 |
| 35 kV | 0.396 | / | 0.574 | 0.396 | 0.247 | / | 28.8 | 18 | |
| 110 kV | 0.379 | / | 0.557 | 0.379 | 0.230 | / | 25.6 | 16 | |
| ≥ 220 kV | 0.371 | / | 0.549 | 0.371 | 0.222 | / | 25.6 | 16 | |
| Tianjin | 1-10 kV | 0.718 | / | 1.023 | 0.718 | 0.389 | / | 41.6 | 26 |
| 35 kV | 0.695 | / | 0.988 | 0.695 | 0.378 | / | 38.4 | 24 | |
| 110 kV | 0.681 | / | 0.967 | 0.681 | 0.372 | / | 38.4 | 24 | |
| ≥ 220 kV | 0.660 | / | 0.935 | 0.660 | 0.362 | / | 35.2 | 22 | |
| Guizhou | 1-10 kV | 0.628 | / | 0.989 | 0.628 | 0.266 | / | 35 | 22 |
| 35 kV | 0.614 | / | 0.967 | 0.614 | 0.261 | / | 35 | 21 | |
| 110 kV | 0.577 | / | 0.908 | 0.577 | 0.246 | / | 31 | 20 | |
| ≥ 220 kV | 0.552 | / | 0.869 | 0.552 | 0.236 | / | 30 | 19 | |
| Yunnan | 1-10 kV | 0.524 | / | 0.682 | 0.524 | 0.367 | / | 38.4 | 24 |
| 35 kV | 0.499 | / | 0.656 | 0.499 | 0.342 | / | 38.4 | 24 | |
| 110 kV | 0.470 | / | 0.627 | 0.470 | 0.313 | / | 36.8 | 23 | |
| ≥ 220 kV | 0.450 | / | 0.607 | 0.450 | 0.293 | / | 36.8 | 23 | |
| Shenzhen | 1-10 kV | 0.627 | 1.302 | 1.047 | 0.627 | 0.256 | / | 36.1 | 22.6 |
| 35 kV | 0.602 | 1.248 | 1.004 | 0.602 | 0.246 | / | 31 | 19.4 | |
| 110 kV | 0.602 | 1.248 | 1.004 | 0.602 | 0.246 | / | 31 | 19.4 | |
| ≥ 220 kV | 0.574 | 1.190 | 0.957 | 0.574 | 0.235 | / | 26.1 | 16.3 | |
A closer look
On average, two-part pricing offers lower off-peak rates (mean: RMB 0.599/kWh) compared to single-part pricing (mean: RMB 0.682/kWh), with the cost gap reaching as high as RMB 0.07/kWh in some regions. This pattern indicates that businesses with high and predictable electricity demand, especially those operating during off-peak hours, can achieve substantial savings by opting for two-part pricing structures, which combine fixed capacity charges with lower variable rates. Notably, the two-part scheme favors large-scale or capital-intensive manufacturers who can better control and forecast their electricity usage.
Regionally, cost disparities also highlight strategic opportunities. Eastern and coastal regions like Jiangsu, Shandong, and Guangdong, while offering relatively higher base prices, remain attractive due to their robust infrastructure and supply chain integration. However, inland and resource-rich regions such as Inner Mongolia, Xinjiang, and parts of Northeast China consistently present some of the lowest off-peak electricity rates under both pricing systems. These areas are particularly advantageous for energy-intensive sectors like metals processing, chemicals, and data centers. For investors, assessing not only the absolute rate but also the availability of two-part pricing and regional power grid reliability will be critical in optimizing long-term operational costs.
Conclusion
The Chinese government is aware of the importance of controlling the cost of electricity and has been making efforts to improve transparency in the state-controlled power industry and cut industrial power rates to lower costs for small and medium-sized enterprises.
The expanded scope of two-part pricing and adjustments in time-of-use rates reflects a strategic shift to provide businesses with greater flexibility and potential cost efficiencies. These changes encourage off-peak energy consumption, support more efficient energy use, and help businesses manage their electricity costs effectively.
At the same time, China’s electricity grid is reliable and usually does not require the backup power generation needed in other lower-cost manufacturing destinations in Asia like India, Vietnam, Myanmar, and Cambodia.
For foreign investors, these policy updates underscore the importance of strategic planning—both in selecting business locations and designing operational models. Regions with lower electricity rates offer significant cost-saving potential, particularly for energy-intensive sectors. Operating during off-peak or deep-discount periods, or in areas with high renewable penetration and flexible tariffs, can further enhance efficiency. Manufacturers that embrace behind-the-meter storage and smart charging strategies stand to gain both operational and environmental advantages. As China builds a greener grid, the most competitive enterprises will be those that treat electricity not just as a cost, but as a strategic asset.
To stay ahead, investors must closely track policy developments and regional pricing trends, which are key to optimizing expenses and sustaining a competitive edge in China’s evolving energy landscape.
The information provided is for general purposes only. No liability is assumed for the completeness or accuracy of the information. For personalized advice on specific business queries, consult our experts at Dezan Shira & Associates by emailing China@dezshira.com.
About Us
China Briefing is one of five regional Asia Briefing publications. It is supported by Dezan Shira & Associates, a pan-Asia, multi-disciplinary professional services firm that assists foreign investors throughout Asia, including through offices in Beijing, Tianjin, Dalian, Qingdao, Shanghai, Hangzhou, Ningbo, Suzhou, Guangzhou, Haikou, Zhongshan, Shenzhen, and Hong Kong in China. Dezan Shira & Associates also maintains offices or has alliance partners assisting foreign investors in Vietnam, Indonesia, Singapore, India, Malaysia, Mongolia, Dubai (UAE), Japan, South Korea, Nepal, The Philippines, Sri Lanka, Thailand, Italy, Germany, Bangladesh, Australia, United States, and United Kingdom and Ireland.
For a complimentary subscription to China Briefing’s content products, please click here. For support with establishing a business in China or for assistance in analyzing and entering markets, please contact the firm at china@dezshira.com or visit our website at www.dezshira.com.
- Previous Article New Guidelines for Implementing China’s Anti-Foreign Sanctions Law: An Explainer
- Next Article Accounting Digitalization in China 2025: Electronic Voucher Accounting Data Standards Promoted Nationwide